OpenWrtルータやAPの監視用に導入したPrometheus Node Exporterでは、WiFi接続中デバイスの情報のMACアドレスまでは分かるものの、肝心のデバイス名が収録されていません。オリジナルのコレクタプローブluaファイルを改造して、ホスト名を含めた仕様へ拡張、Grafanaで一覧表示させました。
wifi_stations.luaコレクタプローブの仕様
OpenWrtデバイスにPrometheus Node Exporterを導入し、PrometheusのフロントエンドであるGrafana上にダッシュボードをセットアップするところまでを、以前構築しました。
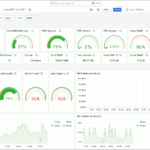
WiFi接続中のクライアントデバイスは、ダッシュボード上の Wifi Stations 項であり、それは wifi_stations と言うメトリクスを参照していることが分かります。

図1.Grafana OpenWrt ダッシュボード
その生データを直接開いてみると、様々な統計情報と共に、クライアントデバイスのMACアドレスを見つけることはできるものの、ホスト名のようなものはありません。

図2.wifi_stationsメトリクスデータ
コレクタプローブwifi_stations.luaを確認すると、中でデータのネタ元としているのは、 iwinfo assoclist コマンドであることが判明。

試しにターミナル上で実行してみると、やはりここでもホスト名は分からず。
|
1 2 3 4 5 6 7 8 9 10 |
root@vWrt:~# iwinfo wlan0 assoclist 44:5D:5E:45:04:2C -40 dBm / unknown (SNR -40) 2610 ms ago RX: 65.0 MBit/s, MCS 7, 20MHz 1533966 Pkts. TX: 72.2 MBit/s, MCS 7, 20MHz 241889 Pkts. expected throughput: unknown 60:01:94:00:FC:A2 -57 dBm / unknown (SNR -57) 40 ms ago RX: 54.0 MBit/s 58793178 Pkts. TX: 54.0 MBit/s 55307004 Pkts. expected throughput: unknown |
他のコレクタプローブパッケージ
他に何か似通ったコレクタプローブのパッケージが無いか、調べてみると hostapd 関連で以下の2つがヒットするも、そのうちの前者は別途フル仕様でビルドされたhostapd / wpadを必要とするようなのでナンセンス。
- prometheus-node-exporter-lua-hostapd_stations
- prometheus-node-exporter-lua-hostapd_ubus_stations

図3.hostapd関連プローブパッケージ
後者は名前からしてOpenWrt ubus経由で取得するようなので、そのまま導入できそう。
|
1 2 |
root@vWrt:~# opkg install prometheus-node-exporter-lua-hostapd_ubus_stations root@vWrt:~# /etc/init.d/prometheus-node-exporter-lua restart |
パッケージをインストールの後、サービスを再起動して再度メトリクスの生データを確認するも、残念ながらここにもホスト名はありませんでした。
|
1 2 3 4 5 6 7 8 9 10 11 12 13 14 15 16 17 18 19 20 21 22 23 24 25 26 |
# TYPE hostapd_ubus_station_rrm_caps_link_measurement gauge # TYPE hostapd_ubus_station_rrm_caps_neighbor_report gauge # TYPE hostapd_ubus_station_rrm_caps_beacon_report_passive gauge # TYPE hostapd_ubus_station_rrm_caps_beacon_report_active gauge # TYPE hostapd_ubus_station_rrm_caps_beacon_report_table gauge # TYPE hostapd_ubus_station_rrm_caps_lci_measurement gauge # TYPE hostapd_ubus_station_rrm_caps_ftm_range_report gauge hostapd_ubus_station_rrm_caps_link_measurement{ifname="wlan0",station="b0:b2:1c:##:##:##",freq="2437"} 0 hostapd_ubus_station_rrm_caps_neighbor_report{ifname="wlan0",station="b0:b2:1c:##:##:##",freq="2437"} 0 hostapd_ubus_station_rrm_caps_beacon_report_passive{ifname="wlan0",station="b0:b2:1c:##:##:##",freq="2437"} 0 hostapd_ubus_station_rrm_caps_beacon_report_active{ifname="wlan0",station="b0:b2:1c:##:##:##",freq="2437"} 0 hostapd_ubus_station_rrm_caps_beacon_report_table{ifname="wlan0",station="b0:b2:1c:##:##:##",freq="2437"} 0 hostapd_ubus_station_rrm_caps_lci_measurement{ifname="wlan0",station="b0:b2:1c:##:##:##",freq="2437"} 0 hostapd_ubus_station_rrm_caps_ftm_range_report{ifname="wlan0",station="b0:b2:1c:##:##:##",freq="2437"} 0 hostapd_ubus_station_rrm_caps_link_measurement{ifname="wlan0",station="3c:71:bf:##:##:##",freq="2437"} 0 hostapd_ubus_station_rrm_caps_neighbor_report{ifname="wlan0",station="3c:71:bf:##:##:##",freq="2437"} 0 hostapd_ubus_station_rrm_caps_beacon_report_passive{ifname="wlan0",station="3c:71:bf:##:##:##",freq="2437"} 0 hostapd_ubus_station_rrm_caps_beacon_report_active{ifname="wlan0",station="3c:71:bf:##:##:##",freq="2437"} 0 hostapd_ubus_station_rrm_caps_beacon_report_table{ifname="wlan0",station="3c:71:bf:##:##:##",freq="2437"} 0 hostapd_ubus_station_rrm_caps_lci_measurement{ifname="wlan0",station="3c:71:bf:##:##:##",freq="2437"} 0 hostapd_ubus_station_rrm_caps_ftm_range_report{ifname="wlan0",station="3c:71:bf:##:##:##",freq="2437"} 0 node_scrape_collector_duration_seconds{collector="hostapd_ubus_stations"} 0.0025479793548584 node_scrape_collector_success{collector="hostapd_ubus_stations"} 1 |
ubusでgetHostHintsを呼び出す
実は別記事でethersデータベースの内容をPrometheus Node Exporterで晒す仕組みを製作したのは、デバイスのMACアドレスとホスト名の紐付け情報がそこにあるためでした。
[post.7050]
ただ、受け取り側のPrometheus+Grafanaでの処理の複雑さを考えると、あまり現実的ではないようにも。
そこで視点を替えて、既存のコレクタプローブ wifi-stations.lua の改造を志向するに当たり、白羽の矢を立てたのがLuCI.rpcのgetHostHints()メソットです。

ターミナルから ubus call で実際に呼び出してみるとこれがかなり優秀で、データのネタ元にethersデータベースが含まれていることや、IPアドレスやホスト名が網羅されていました。
|
1 2 3 4 5 6 7 8 9 10 11 12 13 14 15 16 17 18 19 20 21 22 23 |
root@vWrt:~# ubus call luci-rpc getHostHints { "2A:46:9A:##:##:##": { "ipaddrs": [ "192.168.51.163" ], "ip6addrs": [ ], "name": "iPhone13mini-rdm" }, "52:AC:28:##:##:##": { "ipaddrs": [ ], "ip6addrs": [ ], "name": "BMH-AN10" }, } |
wifi_stations.luaプローブの改造
コレクタプローブwifi_stations.luaへ加える変更点は、次の3つ。
|
1 2 3 4 5 6 7 8 9 10 11 12 13 14 15 |
1) getHostHint JSONオブジェクト格納 local hints = ubus:call("luci-rpc", "getHostHints", {}) 2) MACアドレスをキーにマッチすれば変数格納 local hintname = "unknown" if hints[mac] then hintname = hints[mac].name end 3) ラベルにname属性を追加して変数の内容を当てる local labels = { . . name = hintname, } |
実際に改変した wifi_stations.lua の全体像は次の通り。行頭に + とあるのが追記部分です。
|
1 2 3 4 5 6 7 8 9 10 11 12 13 14 15 16 17 18 19 20 21 22 23 24 25 26 27 28 29 30 31 32 33 34 35 36 37 38 39 40 41 42 43 44 45 46 47 48 49 50 51 52 53 54 55 56 57 58 59 60 61 62 63 64 65 66 67 68 69 70 71 72 73 74 75 76 77 |
local ubus = require "ubus" local iwinfo = require "iwinfo" local function scrape() local metric_wifi_stations = metric("wifi_stations", "gauge") local metric_wifi_station_signal = metric("wifi_station_signal_dbm","gauge") local metric_wifi_station_inactive = metric('wifi_station_inactive_milliseconds', 'gauge') local metric_wifi_station_exp_thr = metric('wifi_station_expected_throughput_kilobits_per_second', 'gauge') local metric_wifi_station_tx_bitrate = metric('wifi_station_transmit_kilobits_per_second', 'gauge') local metric_wifi_station_rx_bitrate = metric('wifi_station_receive_kilobits_per_second', 'gauge') local metric_wifi_station_tx_packets = metric("wifi_station_transmit_packets_total","counter") local metric_wifi_station_rx_packets = metric("wifi_station_receive_packets_total","counter") local metric_wifi_station_tx_bytes = metric('wifi_station_transmit_bytes_total', 'counter') local metric_wifi_station_rx_bytes = metric('wifi_station_receive_bytes_total', 'counter') local u = ubus.connect() local status = u:call("network.wireless", "status", {}) + local hints = u:call("luci-rpc", "getHostHints", {}) for dev, dev_table in pairs(status) do for _, intf in ipairs(dev_table['interfaces']) do local ifname = intf['ifname'] if ifname ~= nil then local iw = iwinfo[iwinfo.type(ifname)] local count = 0 local assoclist = iw.assoclist(ifname) for mac, station in pairs(assoclist) do + local hintname = "unknown" + if hints[mac] then + hintname = hints[mac].name + end local labels = { ifname = ifname, mac = mac, + name = hintname, } if station.signal and station.signal ~= 0 then metric_wifi_station_signal(labels, station.signal) end if station.inactive then metric_wifi_station_inactive(labels, station.inactive) end if station.expected_throughput and station.expected_throughput ~= 0 then metric_wifi_station_exp_thr(labels, station.expected_throughput) end if station.tx_rate and station.tx_rate ~= 0 then metric_wifi_station_tx_bitrate(labels, station.tx_rate) end if station.rx_rate and station.rx_rate ~= 0 then metric_wifi_station_rx_bitrate(labels, station.rx_rate) end metric_wifi_station_tx_packets(labels, station.tx_packets) metric_wifi_station_rx_packets(labels, station.rx_packets) if station.tx_bytes then metric_wifi_station_tx_bytes(labels, station.tx_bytes) end if station.rx_bytes then metric_wifi_station_rx_bytes(labels, station.rx_bytes) end count = count + 1 end metric_wifi_stations({ifname = ifname}, count) end end end end return { scrape = scrape } |
サービスを再起動して反映後、ブラウザでメトリクスの生データを確認、これでメトリクスにホスト名が網羅されました。

図4.メトリクスデータにホスト名入り
Grafanaダッシュボードで一覧表示
図1のOpenWrtダッシュボードから必要な項目を抜き出し、複数デバイスを1画面で監視できるダッシュボードを作成、その右にWiFi接続中のクライアント数(下図矢印)と、クライアント一覧(下図赤枠内)を信号強度と共に表示させました。

図5.Grafana WiFiクライアント一覧
WiFiクライアント一覧はGrafanaのTableパネルを使用、不要な項目をフィルタリングで除外した上で、ホスト名の他に信号強度をしきい値で色分け定義しています。

図6.Grafana Table パネル設定